

Demographic characteristics and utilization of health care of patients
As shown in Table 3, the survey respondents were predominantly women (55.05%), aged 61–70 years (48.48%), married (98.77%), and unemployed/retired (70.09%). The majority had a junior school education (37.93%), and the dominant group had an average monthly household income of less than 3,000 yuan (27.72%).
Evaluation of the status of health service quality in CHCs
Table 4 presents the total PCAT scores and the scores across 10 dimensions. The overall average PCAT score for all CHCs was 30.72 (SD = 3.27). Institution 6 had the highest score at 34.04 (SD = 2.03), while Institution 1 had the lowest score at 27.82. All dimension scores were above 2.50, indicating general patient satisfaction.
Table 5 summarizes the self-evaluation scores of CHCs across six dimensions. Overall, most CHCs were at level-2, with one CHC at level-1, four at level-2, and four at level-3. The average score across all institutions was 76.33 (SD = 13.34). The top three institutions were Institution 7 (90.00), Institution 6 (88.13), and Institution 9 (87.50). The bottom three were Institutions 2, 1, and 3, with the lowest score being 52.38.
Figure 2 illustrates the PCAT scores for each dimension relative to the CHCs’ PCMH status. Interestingly, level-2 CHCs had a lower overall PCAT score (29.76) compared to level-1 CHCs (29.82). Specifically, the PCAT scores for First contact (utilization), Comprehensiveness (available), and Comprehensiveness (provided) were lower for level-2 than for level-1. Additionally, the PCAT scores in the Coordination (Information system) dimension decreased as the PCMH level increased. Conversely, the PCAT scores in dimensions such as First contact (accessibility), Ongoing care, Coordination (Referral system), Family-centeredness, Community orientation, and Cultural competence increased with higher PCMH levels.
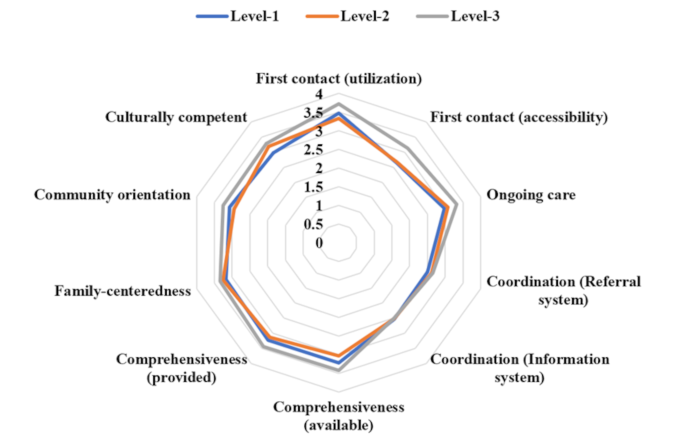
Polar graph of PCAT scores for each dimension for different levels of PCMH status
Correlation analysis of PCAT and PCMH scores
Figure 3 illustrate the correlation between the dimensions of the PCAT and the PCMH. Overall, there was a strong positive correlation between the total scores of PCAT and PCMH (r = 0.71, p < 0.05). Specifically, within the dimensions of PCMH, Team-based care (r = 0.81, p < 0.05) and Care management and support (r = 0.73, p < 0.05) showed high correlations with Ongoing care (PCAT). Additionally, the scores of Care coordination and care transitions were positively correlated with the scores of First contact (accessibility) (r = 0.79, p < 0.05) and Coordination (Referral system) (r = 0.67, p < 0.05).
Among the dimensions of PCAT, all dimensions except for Coordination (Referral system), Coordination (Information system), Family-centeredness, and Culturally competent were related to the performance measurement and quality improvement scores, with First contact (accessibility) showing the highest correlation (r = 0.86, p < 0.05).
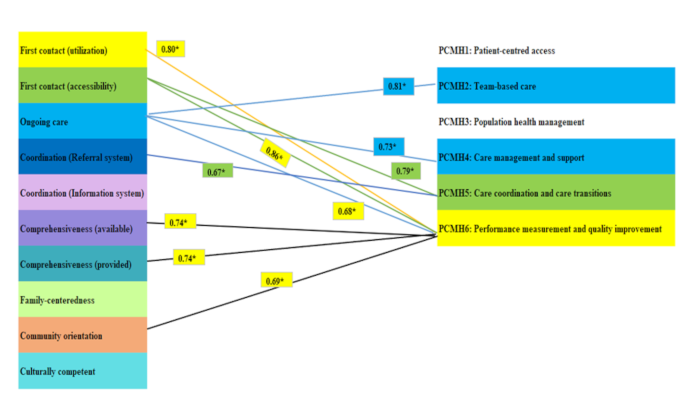
Analysis of the linear correlation between PCAT and PCMH scores. Note: *: p < 0.05
The total score of PCMH is correlated with the total score of PCAT, r = 0.71 (p < 0.05).
Multiple logistic regression analysis of PCAT grouped by PCMH score
Using multiple logistic regression analysis, CHCs were categorized into three groups (Level-1, Level-2, and Level-3) based on their PCMH scores. With Level-1 as the control group, we controlled for demographic characteristics and service utilization information of patients to analyze the influence of PCAT dimensions on community grouping (Table 6). Compared to patients in Level-1 CHCs, an increase in the PCAT scores for Ongoing care (OR: 4.57, 95% CI: 2.44–7.55, P < 0.001), Family-centeredness (OR: 3.39, 95% CI: 1.76–6.52, P < 0.001), and Culturally competent (OR: 4.27, 95% CI: 2.28-8.00, P < 0.001) was associated with a higher likelihood of being in a Level-2.
CHC (P < 0.05).
For Level-3 CHCs, higher scores in Ongoing care (OR: 4.54, 95% CI: 1.05–7.04, P < 0.001) and Culturally competent (OR: 2.83, 95% CI: 1.41–5.68, P = 0.03) were linked to a higher PCMH level compared to Level-1. Conversely, increases in the scores for First contact (utilization) (OR: 0.12, 95% CI: 0.06–0.22), First contact (accessibility) (OR: 0.21, 95% CI: 0.08–0.52), Comprehensiveness (available) (OR: 0.32, 95% CI: 0.17–0.57), and Community orientation (OR: 0.04, 95% CI: 0.01–0.11) were associated with a lower probability of being in a Level-2 CHC compared to Level-1.
Similarly, in Level-3 CHCs, higher scores in First contact (utilization) (OR: 0.21, 95% CI: 0.10–0.43), Comprehensiveness (available) (OR: 0.18, 95% CI: 0.08–0.39), and Community orientation (OR: 0.03, 95% CI: 0.01–0.09) were associated with a lower likelihood of being in a Level-3 CHC compared to Level-1.
Control variables: Demographics (Gender, age, marital status, occupation, employed, education, family income, district, health insurance) and health service utilization (frequency of seeking health service in CHC, times seeking outpatient service in the previous year, hospitalization in the previous year, self-perceived health status, physical or mental disease lasting over one year, and chronic disease).
link